Changes in the weather that contribute to avalanches can change a person’s day, or life, depending on how prepared they are. On average, 27 people a year die from avalanches in the US, with more than a third of those deaths in Colorado. To encourage public safety, Colorado Avalanche Information Center (CAIC) sought to provide forecast data to users in a more accessible and intuitive way that would contribute to greater awareness of dangerous snow conditions.
“The original CAIC website was built on older technology that was not mobile responsive or dynamic,” says Jacob Barney at CAIC. The older site made it hard for different types of users to access potentially life saving information. As a designer on the team tasked with updating the CAIC system and website, I felt the importance of supporting CAIC’s goals to make the information more accessible and intuitive to help save lives.
Our approach combined the following usability strategies:
A. Put the homepage first!
B. Apply new technologies to avalanche forecasting and adhere to established industry communication standards.
C. Provide access to different tiers of information.
A. Put the homepage first!
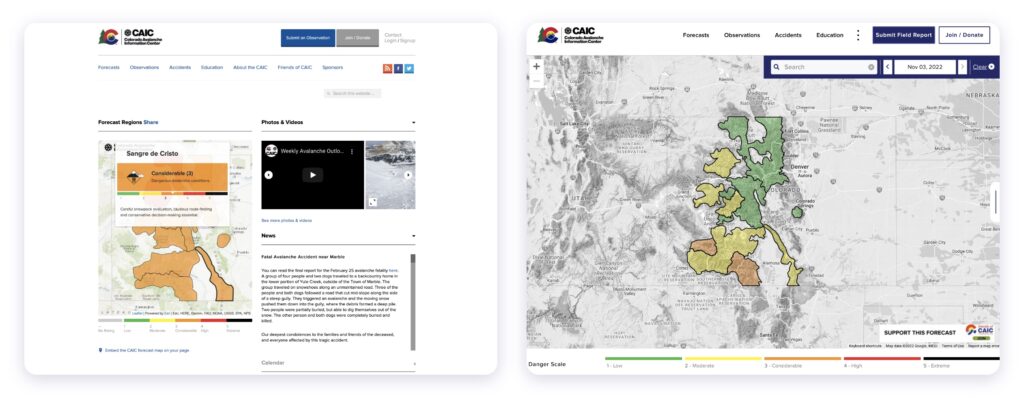 Image: The original homepage on left and new homepage with expanded map on right.
Homepages or landing pages are the first pages people see so they should highlight the most important and useful information. For the Colorado Avalanche Information Center project, the most important message is the statewide map of avalanche danger ratings.
Out with the old
On the old site, the map was a small left justified feature that users could click on to view detailed forecasts. This data was important, but the size and scale of the information made everything less accessible to all skill levels.
In with the new
Building upon some initial design ideation for the homepage conducted by another design firm, Berger and Föhr, we set out to change the dynamic of how each user interacted with the map, and make it the focal point of the new homepage.
The large center-aligned map is the first thing a user sees and interacts with. This map, like most other digital maps and forecasts, has what we call ‘polygons’. These color-coded polygons show the user how likely their chosen area is to produce an avalanche. Colors range from green, meaning “okay to go”, to black, meaning “definitely avoid that area”.
Trays for days
We also wanted to set the stage for a more robust experience with the map generating understandable information without jumping to other pages. Although the polygons are not a new feature, the interaction with them and accessible information corresponding with each is updated by the addition of a danger slidable tray.
Polygons are great for forecasting, but for more experienced users and adventurers they might not provide enough information. Enter the slidable all-encompassing forecast tray. Trays are simply a container designed to encapsulate multiple types of information such as graphs, text, and images. Usually trays house information or menus that are of great importance and require some sort of action. CAIC wanted a tray that revealed as much or as little data as the user wanted to see. They wanted the tray to be modern, usable, and accessible to the various types and skill levels of their users. Every user is different, so including as much information as possible without overwhelming or underwhelming the user was the real goal. Most importantly, the data had to be accessible to ensure that everyone could understand it and interpret the information they needed to stay safe.
B. Apply new tech to universal guidelines
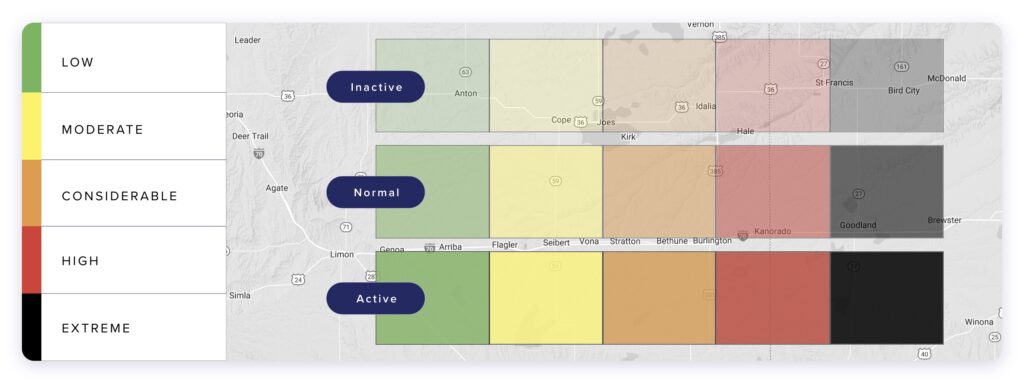
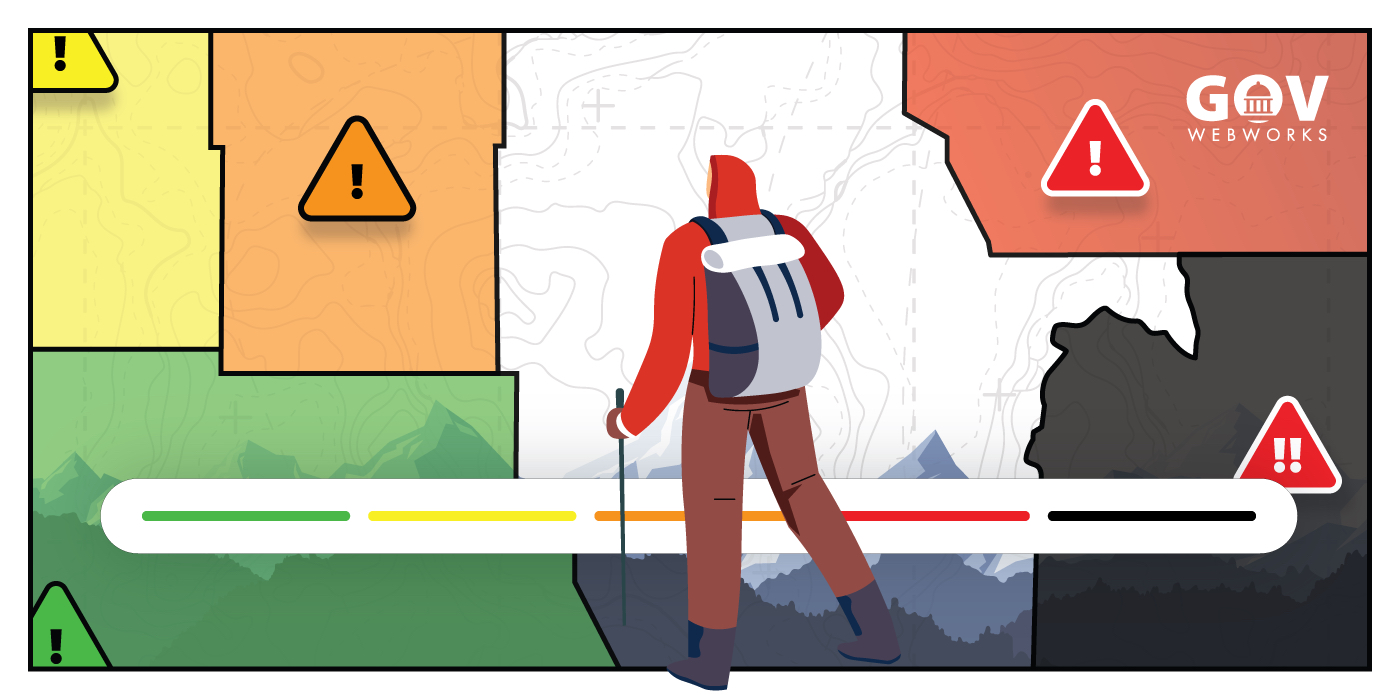
Image: Color-coded states to indicate danger levels.
The old site didn’t need a lot of features to make it compliant for people with disabilities or trouble using computers. Although we wanted to stick to universal color guidelines and a set of established icons, that didn’t mean we couldn’t implement them in new ways to make them easier for users to understand.
States (not the U.S kind)
Hover, focus, and selected states are becoming increasingly popular on websites in order to be compliant for people with varying needs. The Colorado Avalanche polygons follow a strict danger-scale coloring system established by numerous avalanche reporting agencies, which could not be changed. What we could change was how these predefined colors are perceived.
These subtle yet necessary changes make it easier for users with color impairments to find the information they seek in a faster and more appealing way.
- Icons: When on hover, the polygon displays a tab above the area, giving a color-coded danger icon that represents what the danger level is for that area. These icons give the users a more prominent signal for understanding what type of danger that area represents.
- Trays: When a polygon is selected, the unselected polygons dim and the chosen polygon becomes more transparent or less opaque and the new slidable tray extends from the right hand side displaying a higher tier of information.
- Focus states: We added focus states that allow for users with keyboard assistive technology to easily scroll through areas with their keyboard while painting a border around the selected item to ensure that this type of user could not get lost on the page.
Lastly we wanted to optimize the website with alt-text for people that couldn’t see or load images. This descriptor text allows users who cannot see images to read or have a screen reader read a description of what is being represented.
All of these changes and additions helped make the site more usable for not only people of varying abilities, but also for people with varying levels of forecasting experience.
C. Provide access to different tiers of information
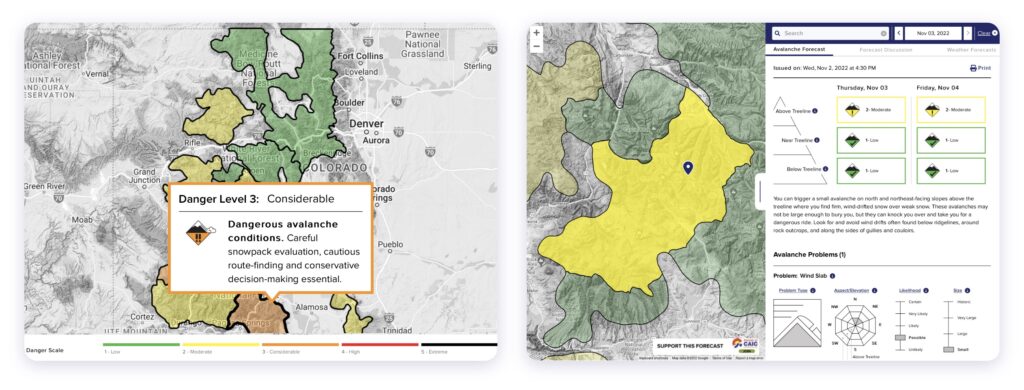
Image: Information tiers allow visitors to access different levels of data in one place.
Making the site accessible for all was vital, but making the site easier to use for all users and skill levels was equally important. Some people simply want to get the data for their area, while others want a robust experience that allows experienced users to take a deep dive into more substantial data.
Breaking down the information
To differentiate between the levels of information, it is presented by the following tiers. Think of it as an information pyramid with the most basic information at the top layer and the more in-depth information in the layers below.
- Tier 1: The top tier is the most easily understandable knowledge, including the danger level scale and avalanche warning tabs. These are represented in the design by small symbols with minimal information (such as icons and color identifiers) that allow for the most basic user to quickly understand what the forecast has been and will be for their selected area. Most people are satisfied with this type of information.
- Tier 2: The next level consists of information that begins the tray experience. This information is based around location and leads off with a treeline graphic that showcases the three levels (above treeline, near treeline, and below treeline). These levels are marked with a color that corresponds to the danger level of that specific altitude. Compliance at each of the levels is represented by the appropriate danger icon.
- Tiers 3 & 4: Then comes a more substantial breakdown of the data within the slidable tray so more experienced users can determine whether or not a selected area is safe. This information consists of substantial graphs such as the avalanche problem type, aspect elevation, likelihood, and size. Each of these graphs provide a more comprehensive breakdown of very specific forecasting data that could give an insight towards the conditions and dangers of a selected area.
- Tier 5: The bottom tier is for deep diving and allows users to submit observations. It provides information observed regarding the snowpack and and general weather.
- Tier 6: the last tier consists of real hard data. This is found deeper in the site and is full of unchecked raw data that is automatically submitted by weather forecasting stations.
In summary
“GovWebworks brought together the technology and design expertise to meet our communication goals,” says CAIC’s Barney. The need for public safety information cannot be undervalued as it can prevent injuries and save lives. Our goal was to support Colorado Avalanche Information Center in updating and supplying the most accurate avalanche forecasts in an accessible and usable format to assure that the information is available to all. As a designer on the project, I found working with CAIC to meet this goal to be an extremely rewarding process.
Learn more
- Project case study: Colorado Avalanche Information Center
- How to use the CAIC website: Video tutorials
- About the new CAIC website: Blog
- Contact GovWebworks for more information about accessibility